
Picture this. You've just run a promotion. Or pushed a new collection live. Or launched a campaign that finally brought the right kind of traffic. A few days later, you check your store analytics. Sales look… fine. Some products clearly did well. Others didn't move. But the question you actually care about is still unanswered:
Which products are winning because they're genuinely strong — and which ones are winning (or losing) because of where they're placed, how they're discovered, or where shoppers drop off?
That's the problem Product Analytics is designed to solve.
Because in most Shopify stores, product performance isn't just about "what sold". It's also about what got seen, what got considered, and what got abandoned before a purchase ever happened. And if you're using a merchandising app like Collection Sort & Manage, product analytics becomes the evidence layer that tells you what to push up, what to protect, and what to fix.
On this page
- 1. Why revenue alone doesn't tell the story
- 2. What Product Analytics measures in Ouiteo
- 3. The "two products" problem every merchant runs into
- 4. What you'll see in the Product Analytics page
- 5. How to interpret the numbers
- 6. A practical way to use Product Analytics in your weekly merchandising rhythm
1. Why revenue alone doesn't tell the story
It's easy to celebrate a product that's bringing in revenue. But revenue is an outcome. It doesn't explain the why.
A product might be selling well because:
- it's genuinely the best fit for shoppers right now, or
- it's getting prime placement (homepage, collection top rows), or
- it's the only obvious choice in a category, or
- it's being driven by one traffic source, or
- it benefits from repeat customers who already know what they want
Equally, a product might be underperforming not because it's weak — but because it's not being discovered, or shoppers are hesitating at a specific step.
That's why the question behind Product Analytics isn't just:
"What sold?"
It's:
"What is getting discovered, what is getting selected, and where is momentum dropping off?"
2. What Product Analytics measures in Ouiteo
Ouiteo's Product Analytics is built around two layers of product performance:
2.1. Commercial performance (what happened)
These metrics show which products are driving your store's results:
- Revenue by Product
- Orders by Product
- Top 100 Products by Revenue
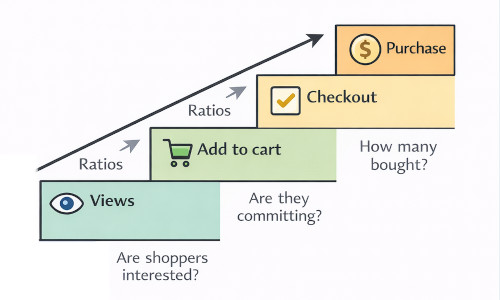
2.2. Behaviour performance (what happened before the outcome)
These metrics show how shoppers interact with products:
- Views by Product
- Add to Cart (product level)
- Checkout (product level)
- Conversion Rate by Product
- Plus helpful ratios (e.g., view → add to cart, add to cart → checkout)
A quick but important note: GA connection is required to unlock behavioural metrics like views, add to cart, checkout, and conversion rate.
If you want to see Product Analytics in your store, it's available inside OT | Collection Sort & Manage (Analytics → Product Analytics).
3. The "two products" problem every merchant runs into
Here's a pattern we see constantly in real stores:
- Product A has strong revenue, but surprisingly low views.
- Product B gets lots of views, but barely converts into add to carts or checkouts.
If you only look at revenue, you'll keep backing Product A and ignore Product B.
But if you look at how shoppers behave, you might discover something more useful:
- Product A might be a quiet winner — it performs extremely well when discovered, but it needs more exposure.
- Product B might be a discovery leak — it attracts attention, but something about the product page, offer, or expectation breaks momentum.
This is the kind of insight that changes how you prioritise merchandising work. Because you're no longer guessing which products "feel" strong. You can see where they succeed — and where they lose shoppers.
4. What you'll see in the Product Analytics page
Product Analytics lives in Ouiteo's Analytics area (not buried inside a collection workflow). It's designed for review, pattern-spotting, and decision-making.
4.1. Top product rankings
You can quickly rank products by:
- Revenue
- Orders
- (and, with GA connected) Views and Conversion Rate
This is where you get your first shortlist: what's winning commercially, and what's winning behaviourally.
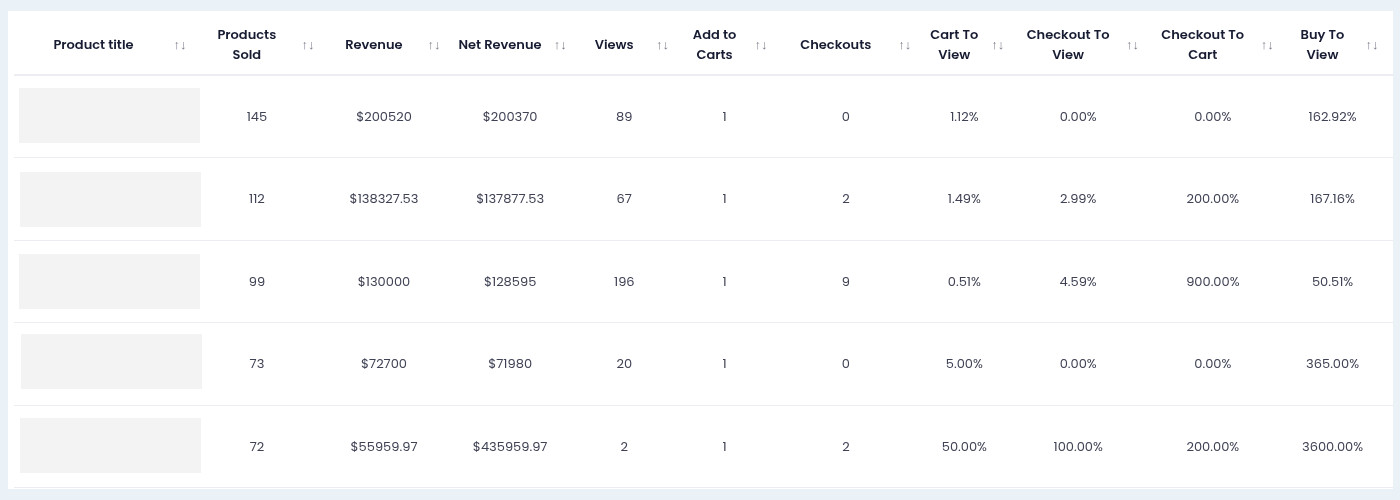
4.2. Top 100 products by revenue
This is the "working table" merchants actually use.
You start with your top revenue products — then layer in behavioural signals:
- Views
- Add to cart
- Checkout
- Conversion rate
- Ratios between steps
This turns "top products" into something more actionable:
- Which top products need protecting (pin, lock, keep visible)
- Which products are rising and deserve promotion
- Which products are leaking attention and need fixing
5. How to interpret the numbers
Product Analytics becomes most useful when you start reading it like a merchandiser, not just a reporter.
Here are a few real-world patterns:
5.1. Pattern 1: High revenue, low views
This often means the product performs extremely well once shoppers reach it.
Common reasons:
- It's a known favourite (repeat purchase)
- It converts strongly when discovered
- It's being found via search or a specific page, not broad browsing
What to do next:
- Consider giving it more exposure in key collections
- Promote it higher during seasonal peaks
- Protect its placement (pin/lock) so it doesn't drift
5.2. Pattern 2: High views, low add to cart
This usually signals a product-page friction problem.
Shoppers are interested enough to click, but not confident enough to commit.
Common causes:
- Price feels high relative to perceived value
- Images don't answer questions
- Variant choice is confusing
- Shipping/returns info isn't visible enough
- The product doesn't match what the collection promised
What to do next:
- Improve the first impression (images, headline, key benefits)
- Clarify variants / sizing / essentials
- Align merchandising (don't send the wrong audience to the product)
5.3. Pattern 3: Strong add to cart, weak checkout follow-through
This often means the product is appealing — but something disrupts intent later.
Common causes:
- Shipping surprise (cost/time)
- Discount expectation not met
- Bundling/upsell friction
- Stock/variant availability issues
What to do next:
- Review checkout experience and messaging
- Check variant availability for the most-clicked options
- Make shipping/returns clarity visible earlier
5.4. Pattern 4: Low revenue, strong conversion rate (with low volume)
This is the classic hidden winner.
It's not selling much because it's not being seen — but when it is seen, it performs.
What to do next:
- Give it better placement inside collections
- Feature it in the right collection(s), not necessarily more everywhere
- Treat it as a product worth testing higher up
5.5. Pattern 5: High views, average add to cart, low conversion
This can indicate the product is being discovered widely, but not by the right shoppers.
It may be overexposed in collections where intent doesn't match, or it's being pulled into too many broad browsing contexts.
What to do next:
- Improve targeting (which collections it appears in)
- Adjust sorting to prioritise products with stronger downstream ratios
6. A practical way to use Product Analytics in your weekly merchandising rhythm
Once a week (or every two weeks):
- Start with Top 100 by revenue: protect the products already carrying your store.
- Identify "quiet winners": low views but strong conversion signals → candidates to promote.
- Identify "discovery leaks": high views but weak add-to-cart/checkouts → candidates to fix (or de-emphasise).
- Turn the insights into placement decisions: this is where Collection Sort & Manage becomes the action layer:
- Push proven winners up in relevant collections
- Pin/lock hero products so they stay visible
- Demote products that repeatedly attract clicks but don't progress
- Review again next period: the goal isn't perfect reporting. It's a tighter loop between insight → merchandising → outcome.
Ready to turn product insights into collection placement decisions? Explore OT | Collection Sort & Manage here.
Final Thought
Product performance isn't just about what sold. It's about what got discovered, what got considered, and where momentum dropped off. Product Analytics helps you see that journey clearly: which products attract attention, which products convert that attention into action, and which products quietly leak intent before customers ever reach checkout. If you're serious about merchandising on Shopify, this is the layer that connects your best sellers to better placement decisions.

Collection Sort & Manage
Optimize Collection Merchandising with 50+ Sorting Options inc. metafields, multi-segment, custom sort type, product group, and lock positions.