
Picture this. You've just launched a new collection. Maybe it's Winter Essentials. Maybe it's Gifts Under £50. Maybe it's a curated edit that took you hours to build: the right mix of products, the right story, the right vibe. A few days later, you check your store analytics. Traffic looks fine. Sales look… okay. But the question you actually care about is still unanswered:
Is this collection helping shoppers discover products — or is it just being visited and forgotten?
That's the problem Collection Analytics is designed to solve. Because in most Shopify stores, collections play a huge role in how customers browse. They're where people scan, compare, and decide whether they've found what they were looking for. Yet when it comes to measuring collection performance, merchants are often stuck with a blurry view of what's happening in the middle of the journey.
Not the checkout. Not the product page. The collection page itself.
On this page
- 1. Why "collection views" alone don't tell the story
- 2. What Collection Analytics measures in Ouiteo
- 3. The "two collections" problem every merchant runs into
- 4. What you'll see in the Collection Analytics page
- 5. How to interpret the numbers
- 6. A practical way to use Collection Analytics in your weekly merchandising rhythm
1. Why "collection views" alone don't tell the story
It's easy to celebrate a collection that gets traffic. But traffic is only a starting point. A collection can get plenty of views and still fail at the thing it's meant to do: help shoppers click into products.
That's why the question behind Collection Analytics isn't "How many people visited this collection?"
It's: When people visit this collection, do they actually click into products? And that's where the real merchandising signals begin.
2. What Collection Analytics measures in Ouiteo
Ouiteo's Collection Analytics focuses on shopper interaction with collection pages and how effectively collections drive product discovery.
It's intentionally built around what you can measure consistently and reliably at the collection layer:
- Collection Views: How many times a collection page was viewed in the selected period.
- Product Views from Collections: How many times shoppers clicked into a product from a collection page. In other words, product clicks generated by the collection.
- Product View / Collection View Ratio: Product Views ÷ Collection Views — how efficiently a collection turns browsing into product clicks.
A quick but important note on wording: the ratio is sometimes described as "conversion" in the sense of converting a collection view into a product click, not a purchase. It's a discovery metric.
If you want to see these collection-level discovery signals in your store, Collection Analytics is available inside Ouiteo (Analytics → Collections).
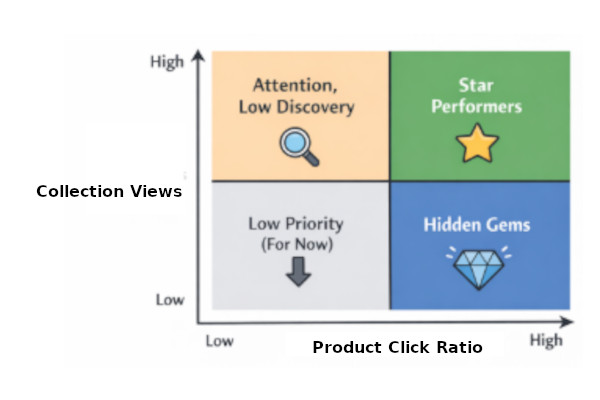
3. The "two collections" problem every merchant runs into
Here's a pattern we see constantly in real stores:
- Collection A gets lots of traffic, but shoppers don't click much.
- Collection B gets less traffic, but a much higher share of visitors click into products.
If you only look at views, you'd assume Collection A is your star. But if you look at product views from collections and the ratio, you might discover the opposite:
- Collection A is attracting attention, but not translating it into exploration.
- Collection B is doing a better job at guiding shoppers into products — which is often the start of a healthier shopping journey.
This is the kind of insight that changes how you prioritise merchandising work. Because you're no longer guessing which collections "feel" like they work. You can see which ones actually prompt shoppers to take the next step.
4. What you'll see in the Collection Analytics page
Collection Analytics lives in Ouiteo's Analytics area. It's designed for review, pattern-spotting, and decision-making.
4.1. Top Collections charts
At the top of the page you'll see charts that highlight the collections driving the most activity.

- Top Collections by Views: A bar chart of the 10 most-viewed collection pages in your selected period — great for identifying where attention concentrates.
- Top Collections by Product Views: A bar chart of the 10 collections that generate the most product views (product clicks from collections). This helps you identify which collections are strongest at pushing shoppers deeper into your catalogue.
4.2. Distribution charts
This is where the analysis becomes genuinely strategic.
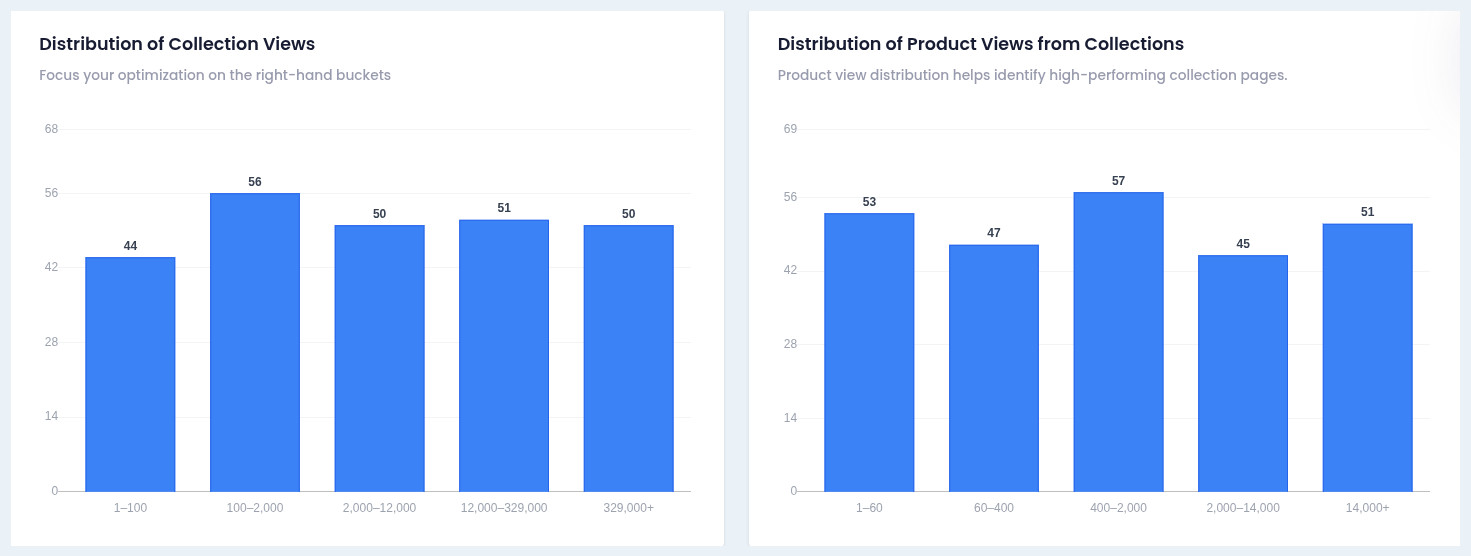
- Distribution of Collection Views: Collections are grouped into view "buckets" (for example 1–8, 8–40, 40–200, 200–1,000, 1,000+), showing how many collections sit in each range. This is a fast way to spot your "head" collections — the ones worth optimising first because they carry the most traffic.
- Distribution of Product Views from Collections: Similar bucketing, but for product views (e.g., 1–5, 5–20, 20–50, 50–200, 200+). This tells you how broadly your collections contribute to product discovery — and whether discovery is concentrated in a few collections or spread across many.
4.3. The all-collections table
At the bottom, you get a full table for the selected period with:
- Search by collection name
- Filtering by Collection Views thresholds
- Export
- Column selector
All designed to make it easy to pull a working list of "collections to improve this week".
5. How to interpret the numbers
Collection Analytics becomes most useful when you start reading it like a merchandiser, not an analyst.
Here are a few real-world patterns:
5.1. Pattern 1: High views, low product views
This often means the collection is attracting the right people, but the collection experience isn't helping them choose.
Common causes:
- The first row isn't compelling (too many similar items, weak bestsellers, wrong mix)
- Too many products without a clear "hero"
- The collection is broad, but the top of the page isn't curated enough to guide decisions
What to do next:
- Improve the "first impression" products
- Revisit how you group products inside the collection
- Consider whether the collection should be split into tighter sub-collections
5.2. Pattern 2: Moderate views, strong product views
This usually indicates the collection is highly relevant to its visitors.
These are often collections worth:
- Featuring more prominently in navigation
- Using as landing pages for campaigns
- Learning from ("what's working here that isn't working elsewhere?")
5.3. Pattern 3: Views concentrated in a few collections
If your view distribution shows most traffic is going to a small "head" set, that's normal — and it's a gift.
It means optimising just a few collections can impact a big share of browsing behaviour.
5.4. Pattern 4: Discovery concentrated in a small set
If product views from collections are concentrated in a handful of collections, it can mean:
- Those collections are doing something right (good assortment, good ordering)
- Or other collections are acting more like "dead ends"
Again: you now have a clear prioritisation list.
6. A practical way to use Collection Analytics in your weekly merchandising rhythm
Once a week (or every two weeks):
- Check top collections by views: identify where attention is flowing.
- Check top collections by product views: identify where discovery is strongest.
- Compare the two: find collections that get attention but don't generate clicks.
- Use the table to pull a shortlist (e.g., high views + low ratio).
- Make one improvement to those collections (sorting, grouping, structure), then review again next period.
This focused approach works because Collection Analytics concentrates on the cleanest behavioural signal at the collection layer: collection views, product clicks generated from those views, and a ratio that tells you whether the collection is doing its job.
Ready to make collection decisions based on real shopper discovery signals? Explore Ouiteo's Collection Analytics here.
Final Thought
Collections aren't where the sale happens. They're where the shopper decides whether they're going to keep going. Collection Analytics helps you see that moment clearly: which collections attract attention, which collections create product discovery, and which collections quietly leak intent before customers ever reach a product page. If you're serious about merchandising on Shopify, this is the layer you can't afford to ignore.

Collection Sort & Manage
Optimize Collection Merchandising with 50+ Sorting Options inc. metafields, multi-segment, custom sort type, product group, and lock positions.